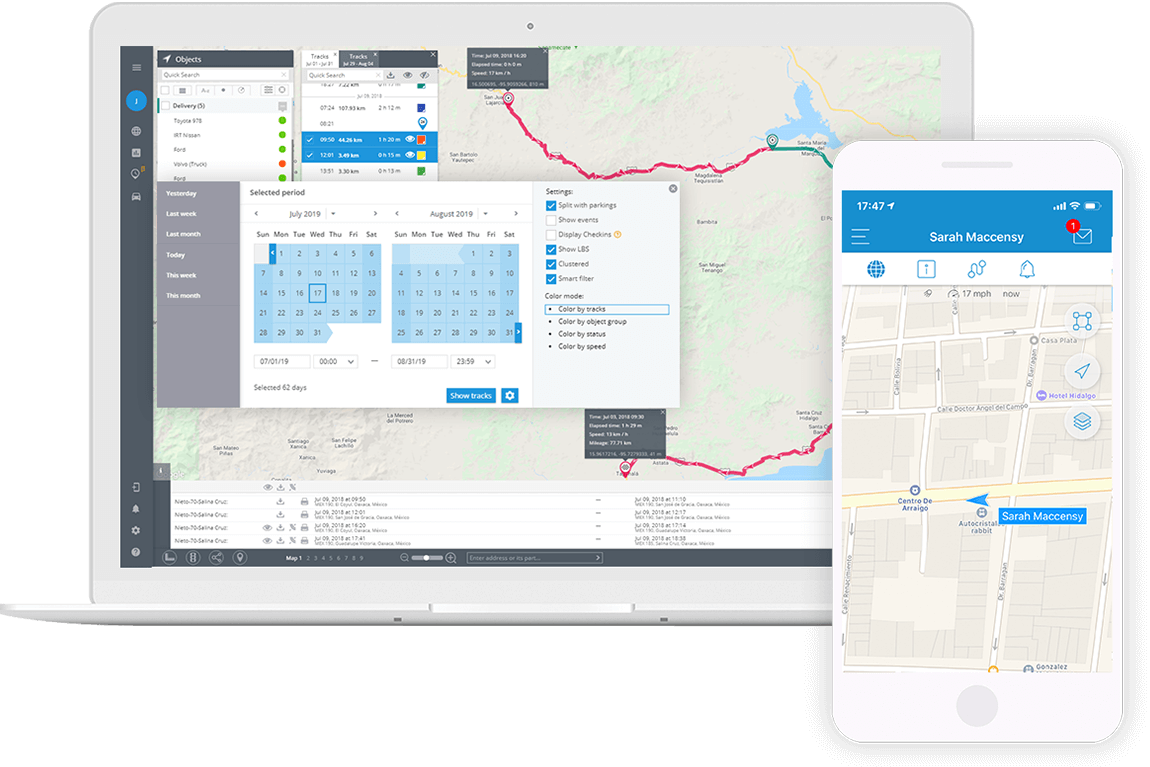
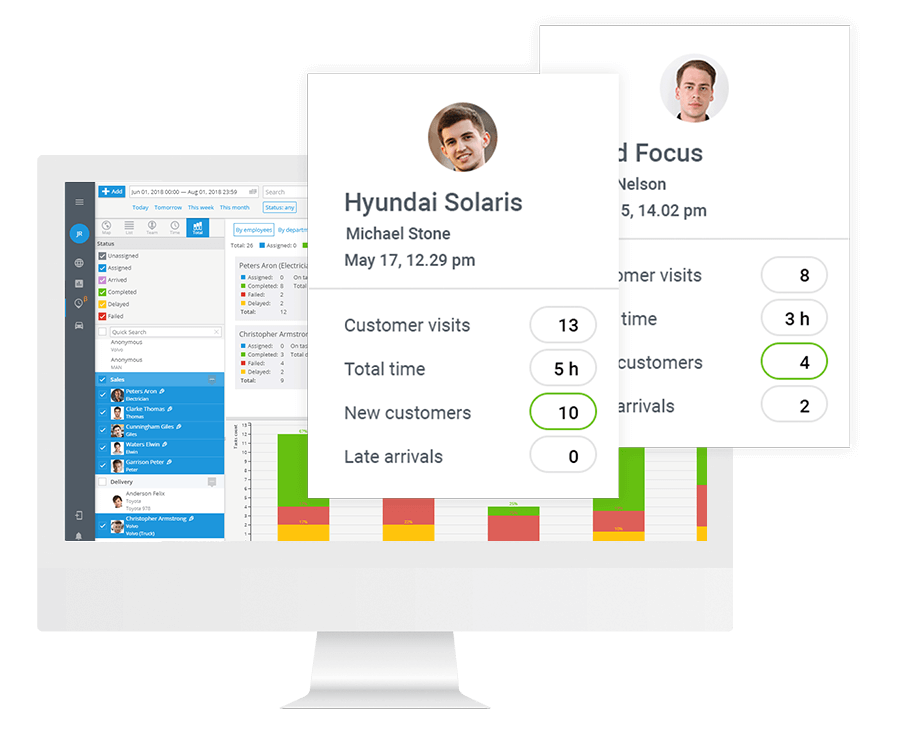
Enjoy comprehensive analytics to evaluate field performance on the spot.
Check data enhanced with colorful charts, graphs and tables for any time periods.
Spot-on Productivity
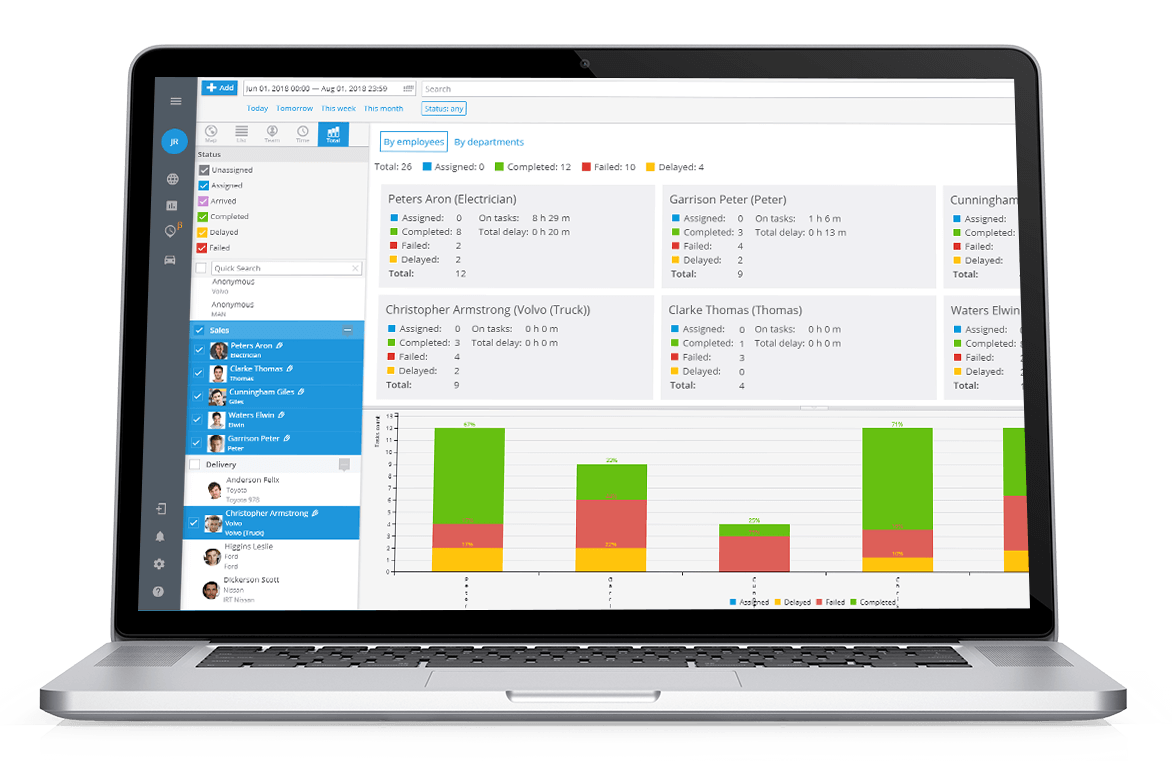
Check assigments progress in a click. Compare employees performance against benchmark values for the number of tasks completed, customer visit durations, number of delays, etc.
All major parameters can be viewed as visual graphs and tables. Apply this feature for real-time or any past data.
Quality Assurance
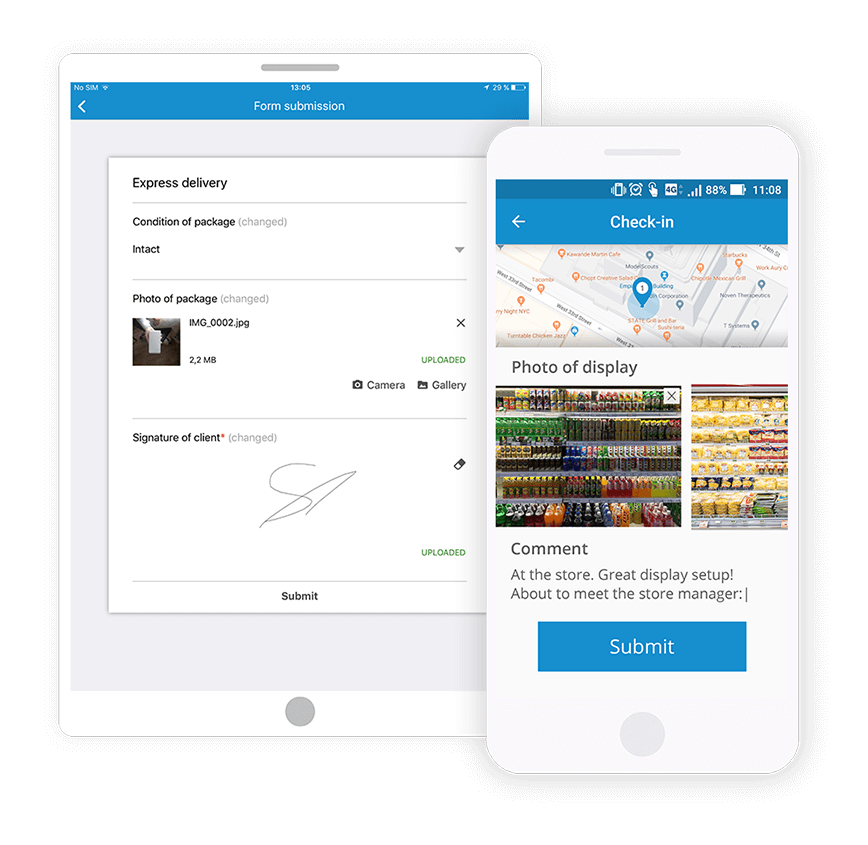
Better customer service means greater customer loyalty. Make sure your team performs well with automatic monitoring of reports data: field pictures, customer ratings and reviews, etc.
Use comprehensive analytics to evaluate the skill level of your specialists. Motivate them to grow professionally and achieve better scores.
Accurate KPI estimates
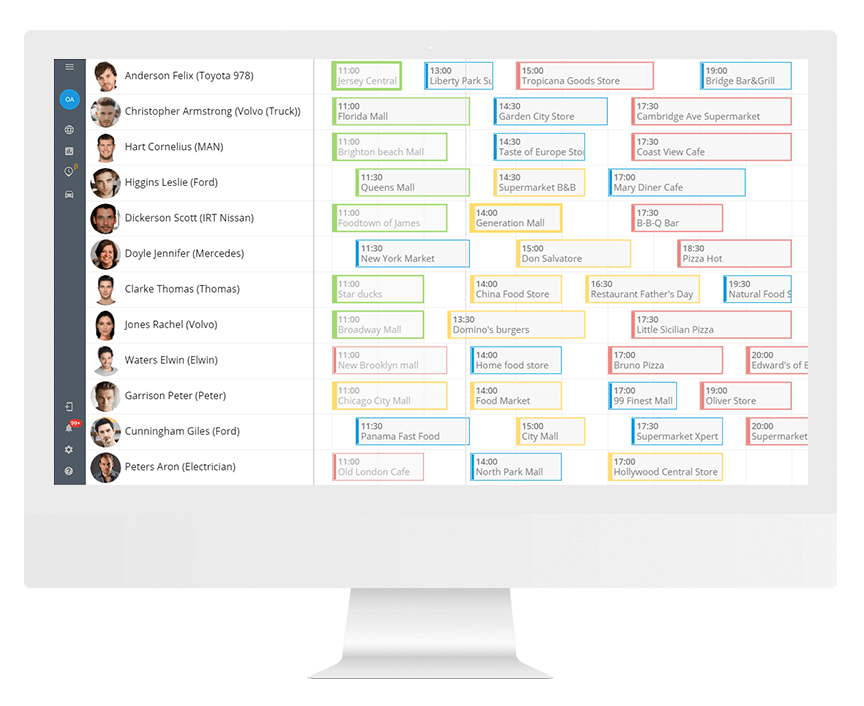
Set and review individual KPIs for every employee or department. Let no parameter slip unnoticed: follow the scope of sales, SKU, accounts receivable, number of visits, trip/ visit durations, delays, etc.
Try automatically generated stats for one or more employees with applicable visual aids. Have them scheduled to inbox not to miss a thing.
Automatic
Take the burden of tedious reports off your employees. Introduce transparent digital data to be generated automatically by any manager or a supervisor.
Convenient
Easily check the reports without exiting the service. If required, any data can be saved as a PDF or XLS file and scheduled to any e-mails as often as needed.

Integrated
Include reports to the corporate workflow. Share data with any departments concerned, e.g. accountants to calculate payroll and compensations.
